The
Green Revolution in Punjab
 |
The
agricultural situation in the state changed dramatically as a consequence
of consolidation of holdings, availability of canal water, tube
well irrigation and establishment (in 1962) of Punjab Agricultural
University with strong research and extension education components
that developed close interactive relationship with the state agriculturists.
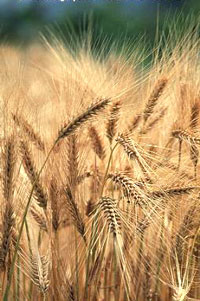
Introduction of dwarf wheat germ-plasm and cultivators from CIMMYT
Mexico in 1964-65, which could easily stand to higher use of fertilizers
without lodging and required assured irrigation, set the stage for
wheat-based green revolution in the state. With this conducive production
environment, assured remunerative prices provided by the government
through price support and procurement system as well as spread of
rural and approach roads network in the state, production and productivity
as well as gross domestic product from agriculture sector started
improving quite fast. Tractors and tube wells started dotting the
landscape everywhere, uses of fertilizers and pesticides expanded
and irrigated area as well as intensity of cropping started increasing.
Even net sown area also increased. The cropping pattern started witnessing
significant changes. The foundations of the Green revolution were thus
laid and enabling infrastructural, technological and economic environment
was rendered conducive for the interaction of elements of growth and
productivity in the state.
|
The
70s: Green Revolution matures:
Dwarf
varieties for Paddy crop was introduced and production increased manifold. By
1970-71 GDP of the state at constant prices increased to Rs. 1509 crores. The ratio
of GDP originating from agriculture increased by 3.4 percentage. Thus agricultural
GDP of the state increased by 86.5 percent from Rs. 473.7 crores to Rs. 866 crores
in one decade. Net sown area increased from 3.76 million hectare in 1960-61
to 4.05 million hectares in 1970-71. Gross sown area increased from 4.73 to
5.68 million hectare and intensity cropping improved from 121 to 140 per cent
over the same period.
Cropping pattern underwent significant changes with area under wheat
increasing from 29.6 per cent to 40.5 per cent of the total cropped area. Per
cent area under pulses declined drastically from over 19 per cent to 7.3 per
cent. By this time, new dwarf varieties of rice from IRRI were introduced and
the area under rice production started expanding. As a result production of
food grains in 1970-71, more than doubled to 7.3 million tonnes from 3.16 million
tonnes in 1960-6, with wheat production increasing to 5.15 million tonnes. Rice
had not as yet caught the imagination of the farmers although area under this
crop and production had started increasing and the future looked bright.
Quantum
jump:
From
here on agricultural sector growth made a quantum jump. Yet with the industrial
and tertiary sector too growing fast, share of agricultural sector in the GDP
started declining which was in tune with classic model of growth and development
of any economy. This growth in agriculture initiated by green revolution in
wheat crop production in late sixties and further fuelled by rice revolution
in mid-70s, continued un-abated under conducive commercial environment both
on production as well as market fronts. By 1993-94 GDP of the state had increased
to Rs. 4565 crores at 1970-71 prices.
Even
with primary sector share declining to 46.76 per cent, Agriculture Sector GDP
touched an all time high of Rs. 2135 crores which is an increase of 147 per cent
over the Sector GDP of 1970-71. Net sown area increased almost to its limit
of over 4.2 million hectares. With cropping intensity of 181 per cent, the gross
cropped area increased to over 62 million hectare. In the cropping pattern,
wheat occupied 43.7 per cent of the gross cropped area. With rice occupying
28.6 per cent area, the food-grain crops accounted for 76.9 per cent of the
gross cropped area.
The production of Pulses and coarse grains got marginalized. Relative area under
oilseeds and sugarcane decreased to over 62 million hectare. In the cropping
pattern. wheat occupied 43.7 per cent of the gross cropped area. With rice occupying
28.6 per cent area, the food-grain crops accounted for 76.9 per cent of the
gross cropped area. Cotton area. however held on with marginal, yet fluctuating,
increases overtime.
More
water, more tractors, more fertilizer:
During this period productivity improved dramatically
with wheat yield increasing from 2.238 tonnes to 4.01 tonnes per hectare and
rice from 1.765 to 3.507 tonnes per hectare. Productivity of other crops such
as American cotton, sugarcane and potato also improved but not that significantly.
This conducive economic environment gave impetus to expansion of tube well irrigation,
tractor cultivation and intensive use of fertilizers As a consequence fertilizer
use increased from 54 kg per hectare of net area sown in 1970-71 to 265.5 kg
per hectare in 1993-94. Pesticides use increased manifolds. The number of tractors
increased from 10 to 80.3 per thousand hectare of net sown area and tube wells
number increased from 192 thousand to 850 thousands in the state. Area irrigated
increased from 71 to 93 per cent of the net sown area. The intensity of cropping
increased to 181 per cent. Production of food-grain increased to 21.58 million
tonne, with wheat production at 13.34 million tonne and rice 7.65 million tonne.
Present
Scenario:
At
present over 84 per cent of the total geographical area of the state stands
cultivated. Only about 28 thousand hectare land is classified as cultivable
waste. This meager area represents terrain, which are very difficult to cultivate.
The state looks like a vast farmstead with only 16 per cent of its geographical
area under cities, towns, villages, rivers, canals, roads, buildings, wastes,
forests etc. There is, thus, little scope for expansion of crop cultivation
horizontally. Vertically, the intensity of cropping is over 181 per cent. There
is, thus, hardly any scope for increasing the intensity of cropping further
with the present set of main economic crops grown in the state.
Factors
responsible for Green Revolution:
-
Mechanization
of Farming: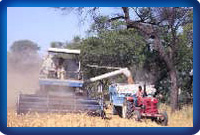
The transmission of new technology infused
new life into the state of Punjab, boosting cropping intensity to183%. Today,
Punjab is the country's leading state in the field of mechanized and modern
farming technology. Intensive agriculture demands the use of diverse machinery
that saves the farmer time and labour.
This comparative chart records the march of mechanization across the farms
and fields of Punjab.
| |
1950-51 |
1996-97 |
1997-98 |
|
Tractors |
4200 |
3,50,000 |
3,65,000 |
|
Tillers |
3100 |
2,35,000 |
2,45,000 |
|
Disc-Harrows |
3000 |
2.55,000
|
2,65,000 |
|
Seed
cum Fertilizer Drills |
2100 |
1,40,000 |
1,45,000 |
|
Spray
Pumps |
2000 |
5,25,000 |
5,40,000 |
|
Reapers |
0 |
3000 |
3,500 |
|
Combines |
0 |
7100 |
4,800 |
|
Threshers |
0 |
3,15,000 |
2,500 |
|
Maize
Shellers |
0 |
2200 |
3,25,000 |
|
Potato
Planters |
0 |
2150 |
2,200 |
|
Cane
Crushers |
6200 |
35,000 |
35,000 |
Tube
wells
|
1600 |
9,00,000
(i) Electric 7,25,000
(ii) Diesel 1,75,000 |
9,25,000
(i) Electric 7,50,000
(ii) Diesel 1,75,000 |
-
Consolidation
of Holdings:
Consolidation of small holdings which was done
very speedily, made mechanized farming economically viable. Coupled with
introduction of HYV dwarf varieties of crop and assured irrigation it resulted
into manifold production of food grain.
-
Loans
to Farmer:
In 1955-56, the state government established
Central Cooperative Banks to provide loans and other inputs to farmers through
the Cooperatives. Farmers utilized easy credit available for purchase of
tractors and other implements and inputs.
-
Establishment
of Regulated Market:
Establishment of regulated markets with network
of yards and sub-yards helped the farmer to get better price for their produce.
This also helped the farmers to come out from the grip of moneylenders and
other petty middleman.
[BACK
TO TOP]